.png)

1. Introduction
This is the third issue of the Loyalty Secrets series, where we dig into public financial data to uncover how large-scale loyalty programs really work.
Most loyalty leaders spend their time thinking about which rewards to issue, and whether their investment is driving greater customer value, all within a tight annual marketing budget!
But beneath every loyalty program, there are also deeper questions:
-
What is the program actually trying to optimise?
-
Is it designed to drive frequency and short-term demand? Or to encourage customers to build longer-term relationships?
-
Can the program generate high-margin revenue from partnerships?
-
Does the program’s balance sheet present a risk, or an asset a that can support the wider business?
The answers to these questions matter because loyalty programs cannot maximise all of these objectives simultaneously, so strategic trade-offs need to be made.
Using the latest financial disclosures from American, Delta, United and Southwest, this year's results provide a particularly clear illustration of how these strategic trade-offs are being made.
We examine how four of the world's largest loyalty programs are evolving, what those changes reveal about their underlying goals, and what loyalty leaders can learn from them.
Our insights come directly from the financial statements and from our own calculations, even when the data are buried in footnotes or ad-hoc releases.
And as always, our objective is not to rate or critique the companies in question. Rather, it’s to uncover the financial mechanics, design choices and strategic implications that often sit hidden within the numbers.
2. The Core Tension
Every loyalty program is balancing the same four forces, and in FY25 we can clearly see that US airlines are making different trade-offs.
All loyalty programs simultaneously need to consider how to:
i. Monetise customer behaviour (issuance)
ii. Control reward cost (redemption)
iii. Grow valuable customer behaviours
iv. Deliver commercial impact through the P&L and balance sheet
But these objectives are often structurally in tension; for example, increasing reward availability boosts engagement, which should lead to higher customer value; but it also lowers breakage, which increases the program’s underlying operating costs.
The choices made by management shape not only how customers interact with the program, but also how the program contributes to growth, profitability and cash flow.
Interestingly, there is no single ‘best’ model – and this year’s financial results show a clear divergence in how the major US airlines prioritise these levers.
Below, we compare two very different models among the US airlines, with different takeaways and considerations for marketing and finance executives: for CMOs, the kind of customer behaviour to target; and for CFOs, how best to time revenue, and optimise balance sheet liability.
3. Two contrasting airline models
Viewed through the four forces outlined above (earn, burn, customer behaviour change and financial impact), Delta and Southwest sit at opposite ends of the spectrum, with American and United sitting between them.
In fact, the difference between Delta and Southwest highlights a fundamental strategic choice in airline loyalty strategy: balance sheet value vs behavioural impact.
Delta’s model is all about leveraging loyalty as both a large-scale financial asset, and a long-term customer engagement lever. Delta’s program has:
-
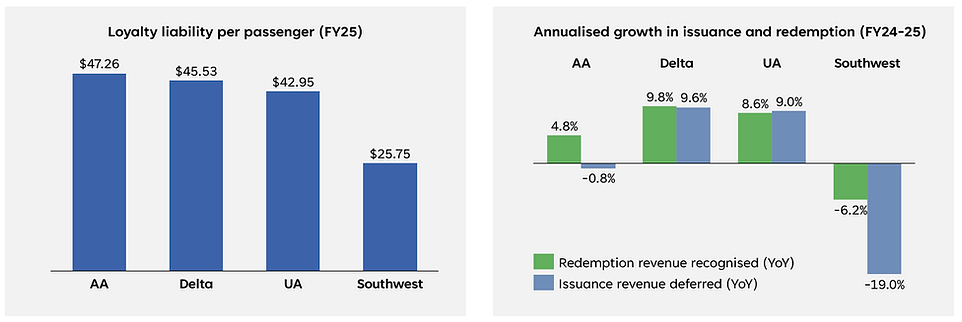
A high liability per passenger ($46 ) – ensuring customers have value locked into the airline’s ecosystem, encouraging a longer-term relationship
-
Slower earn/burn dynamics (51% burndown of loyalty liability within 12m ) – to be expected, given a long-haul network where customers may accumulate miles for higher value rewards
-
Highest non-travel redemption rate (4.9% of redemption) – which increases customer utility and engagement, and also reduces reliance on flight inventory
Delta is also rapidly growing both issuance (9.6%) and redemption (+9.8%) – building out the sources of earn and reward opportunities for members, whilst positioning the program as a key P&L and balance sheet driver for the corporation.
Importantly then, Delta is not simply accumulating liability: issuance and redemption are both growing strongly, suggesting an embedded loyalty ecosystem which is being actively nurtured by management.
This benefit is also made explicit by Delta management, who refer to $8.2B of sales to American Express as “high margin revenue and resilient cash flows.”
Southwest’s model, by contrast, is all about using loyalty as a short term demand and frequency lever. We can see this in:
-
Lower liability per passenger ($26) and a faster earn/burn cycle (69.6% burndown of loyalty liability within 12m) – meaning customers are using rather than saving up their miles
-
High award usage (awards comprise 14% of Revenue Passenger Miles) – making the program a more important driver of demand and seat capacity.
-
Low ‘life of a point’ (the number of years for an average point to be redeemed) – at only 1.4 years for Southwest, compared with 2.0-2.6 for the other major US airlines
American and United sit somewhere between these two poles: still holding high loyalty liabilities of $43-46 per passenger, and with broadly similar issuance growth, but slightly longer reward cycles.
And again, Southwest’s approach of driving shorter earn/burn cycles for direct P&L impact is made explicit in the commentary of Southwest’s management, who stated that changes to their Chase cobrand agreement allowed them to recognise a larger portion of cobrand revenues immediately (rather than being deferred). This makes the P&L look stronger today, in exchange for a smaller ‘float’ on the balance sheet.
This decision by Southwest also highlights the increasing importance of co-brand relationships to both revenue generation and financial management, especially for US airlines.
By contrast, our 2025 report on IAG and Air France-KLM showed far lower loyalty liabilities per passenger (at €24 and €9 respectively), in part due to lower co-brand penetration in UK and EU markets.
But for US airlines, this is not a ‘better vs worse’ – there is no single correct model. Rather, in this contrast between Delta and Southwest, we see how one emphasises long-term customer value creation; the other intends to drive more immediate commercial impact.
4. Loyalty as a customer & commercial engine
Whichever loyalty strategy airlines choose to implement, loyalty programs remain a material driver of the overall business economics – across both revenue, demand and balance sheet:
-
On revenue – loyalty contributes 10–20% of total operating revenue across the four airlines, and this contribution has grown for all airlines except Southwest.
-
On demand – we’ve seen a new statistic released in FY25 10-Ks: the proportion of revenue passenger miles flown on reward tickets, ranging from 9-14% (again Southwest is the highest).
So we now have two clear data points showing loyalty’s influence not just on revenue, but also on seat economics and customer demand.
The implication here is that loyalty success is not just about scale, but also how well a program is integrated into the core business model – how the airlines drive and manage customer demand, as well as reward it.
Finally on balance sheet – combined loyalty liabilities across the four major US airlines almost touch $32B at year-end 2025 – and that offers:
-
a sizeable customer-funded float that creates upfront and predictable cash inflows from partners (like banks and credit cards)
-
a source of deferred revenue that can be deftly managed through breakage or accounting treatment, and recognised on the P&L over multiple years
-
avenues for tax planning – both United and Southwest explicitly flag deferred tax liabilities tied to loyalty program liabilities
-
a structurally favourable balance sheet that supports financing and provides long-term resilience and visibility
For CFOs this provides excellent financial optics and flexibility, and for CMOs it offers strong levers to drive long term customer value growth.
5. Implications beyond airlines
Ultimately, FY25 highlights how that airlines are making deliberate choices about what kind of loyalty currency they want to operate. These choices capture the tension between:
• Store of value vs. more liquid currency
• Balance sheet float vs. more immediate P&L impact
• Focus on core product vs. more partner-driven issuance and reward offers
Some airlines, like Delta, are maintaining long-term stores of value with slower earn-and-burn cycles that build customer stickiness; and others, like Southwest, are behaving more like transactional currencies designed to drive frequency and keep points moving rapidly through the ecosystem.
Neither approach is inherently right or wrong; each reflects different program design choices, intending to drive different customer behaviours, leading to different commercial outcomes.
And while these dynamics are especially visible in US airlines given their scale, and the data they publish, the same underlying design trade-offs apply across all large-scale loyalty ecosystems: in hospitality, retail and financial services.
Loyalty is not only about rewarding customer behaviour; instead it can be a powerful lever for how brands shape demand, manage cash flow, and grow valuable long-term relationships with their customers.
Adam Schaffer, Managing Director
Symbia Advisors © 2026
Sources
American Airlines Group Inc. Form 10-K for the fiscal years ended 31 Dec 2025, 2024
Delta Air Lines, Inc. Form 10-K for the fiscal years ended 31 Dec 2025, 2024
United Airlines Holdings, Inc. Form 10-K for the fiscal years ended 31 Dec 2025, 2024
Southwest Airlines Co. Form 10-K for the fiscal years ended 31 Dec 2025, 2024
Notes
[1] Delta does not provide FY25 passenger volume; therefore liability per passenger estimated based on applying passenger revenue growth rate (FY24-25) to FY24 passenger volume.
[2] This metric represents redemption revenue recognised in FY25 as a proportion of the FY25 opening loyalty liability
[3] Under Accounting Standards Codification (ASC) Topic 606, companies are allowed discretion in their accounting to determine the timing and allocation of revenue recognition.
[4] Loyalty Revenue comprises revenue recognised from both redemption and marketing activities.
[5] Southwest remains the highest at 21% of total operating revenue, but their accounting treatment recognises a larger proportion immediately on the P&L, as mentioned above.
Click image to enlarge

Click image to enlarge

Click image to enlarge

